Komitet Wyborczy Wyborców Samorządowy Ruch Ziemi Cieszyńskiej
| Name: | Komitet Wyborczy Wyborców Samorządowy Ruch Ziemi Cieszyńskiej | |
| Short name: | KWW Samorządowy Ruch Ziemi Cieszyńskiej | |
| Type of committee: | Election committees established by electors | |
| Address: | ul. Przepilińskiego 28, 43-400 Cieszyn | |
| Plenipotentiary: | electoral | financial |
| Mieczysław Jerzy Szczurek | Agnieszka Krystyna Piróg-Kochaniewicz | |
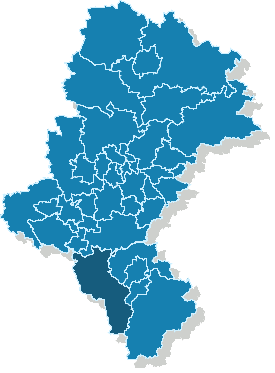
The provinces where the committee has submitted lists of candidates
| Name |
|---|
| pow. cieszyński |
The statistics of election committe
Lists submitted
| Description | Number of |
|---|---|
| Number of lists submitted for province council | 0 |
| Number of lists submitted for county councils | 7 |
| Number of lists submitted for councils of cities holding county rights | 0 |
| Number of lists submitted for districts councils of the cap. city of Warsaw | 0 |
| Number of lists registered for communal councils | 4 |
| Totalling | 11 |
Submitted candidates
| Name | Number of candidates | Women | Women (%) | Men | Men (%) |
|---|---|---|---|---|---|
| Number of candidates submitted for the province council | 0 | 0 | - | 0 | - |
| Number of candidates submitted for county councils | 47 | 17 | 36.17% | 30 | 63.83% |
| Number of candidates submitted for councils of cities holding county rights | 0 | 0 | - | 0 | - |
| Number of candidates submitted for districts councils of the cap. city of Warsaw | 0 | 0 | - | 0 | - |
| Number of candidates registered for communal councils | 12 | 5 | 41.67% | 7 | 58.33% |
| Number of candidates submitted for reeve, mayor and presidential elections | 1 | 0 | 0.00% | 1 | 100.00% |
| Totalling | 60 | 22 | 36.67% | 38 | 63.33% |
Average age of submitted candidates
| Name | Average age | Average age of women | Average age of men |
|---|---|---|---|
| Average age of candidates submitted for the province council | - | - | - |
| Average age of candidates submitted for county councils | 52 | 49 | 53 |
| Average age of candidates for councils of cities holding county rights | - | - | - |
| Average age of candidates for districts councils of the cap. city of Warsaw | - | - | - |
| Average age of candidates submitted for communal councils | 45 | 48 | 43 |
| Average age of candidates for reeve, mayor, president | 67 | - | 67 |
| Totalling | 50 | 49 | 51 |
Submitted candidates grouped by age
| Name | Number of candidates | Women | Women (%) | Men | Men (%) |
|---|---|---|---|---|---|
| 18-29 | 3 | 2 | 66.67% | 1 | 33.33% |
| 30-39 | 5 | 1 | 20.00% | 4 | 80.00% |
| 40-49 | 21 | 8 | 38.10% | 13 | 61.90% |
| 50-59 | 18 | 8 | 44.44% | 10 | 55.56% |
| 60-69 | 13 | 3 | 23.08% | 10 | 76.92% |
| 70+ | 0 | 0 | — | 0 | — |
The youngest and oldest candidate submitted
| Age | Institution | |
|---|---|---|
| Youngest | 27 | Rada Powiatu Cieszyńskiego |
| Oldest | 68 | Rada Powiatu Cieszyńskiego |